
Backtest results
How the settings were found
Two years of data, 18 markets, five timeframes and three signal modes. Settings were chosen on the first year only and checked on the second, then confirmed with real ticks.
Final results (Oct 2024 – Oct 2026)
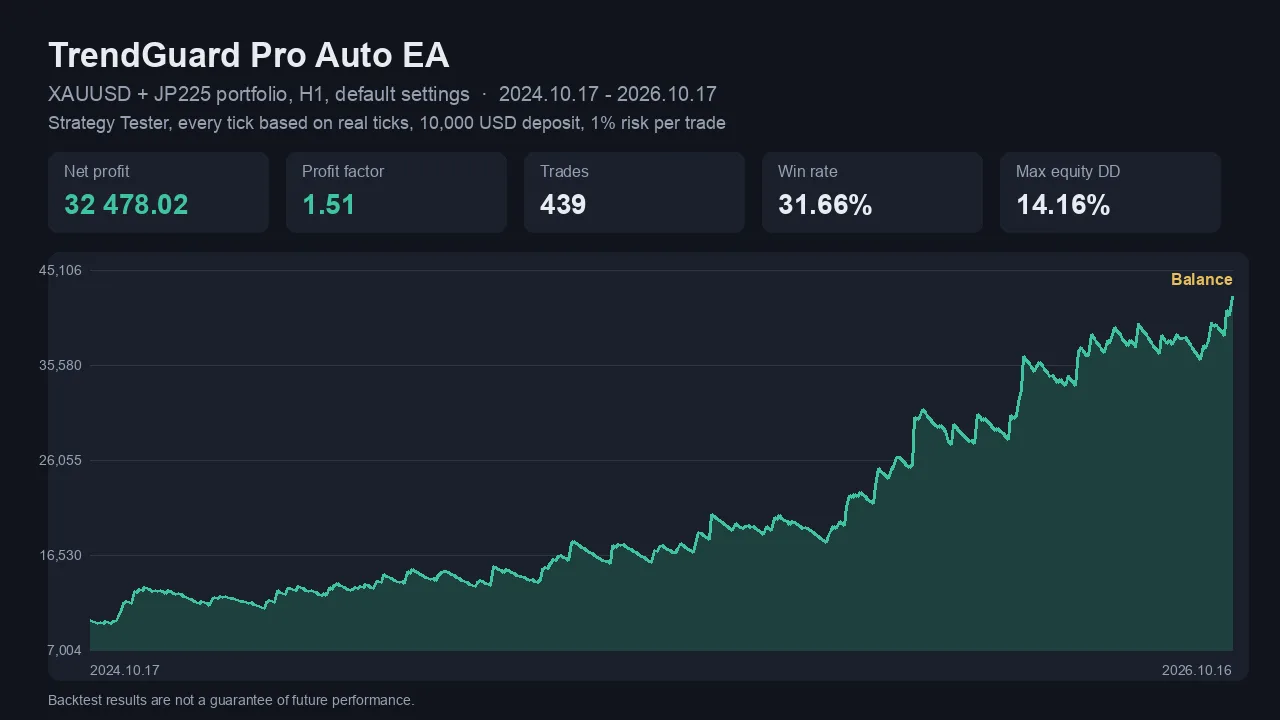
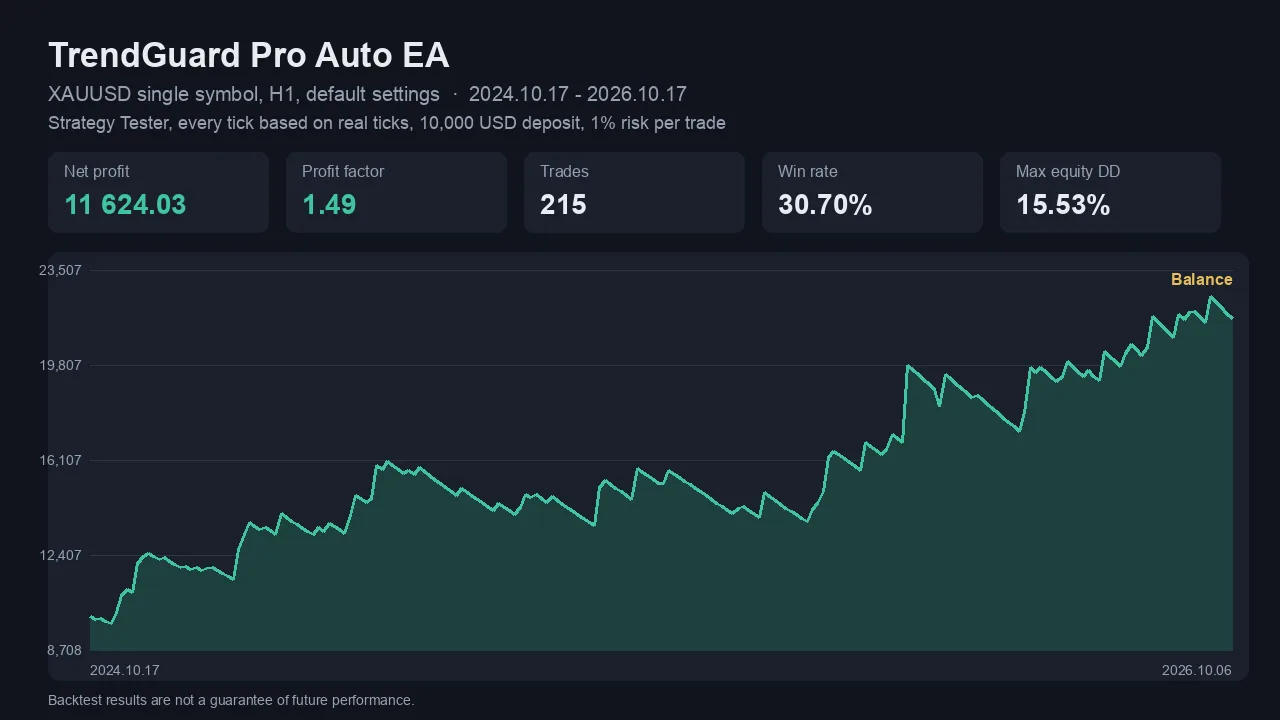
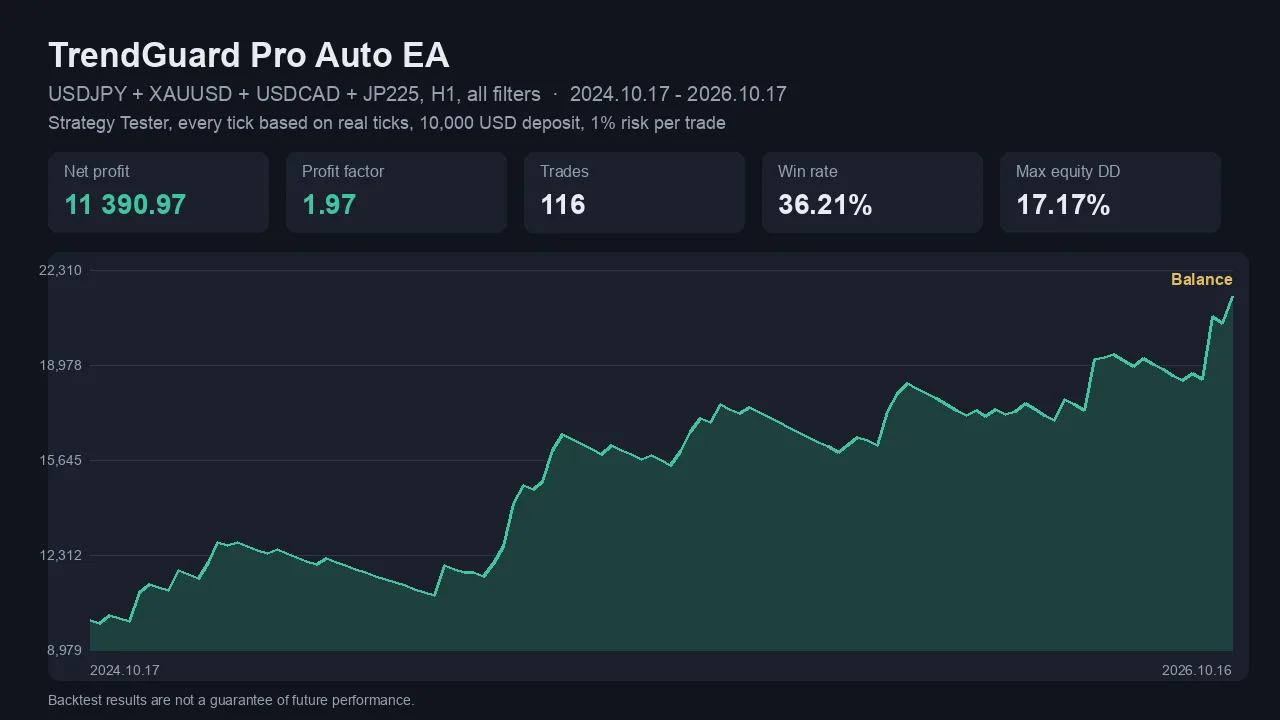
MT5 Strategy Tester, every tick based on real ticks, 10,000 USD deposit, 1:100 leverage, 1% risk of balance per trade, default exits (Supertrend ×2.0, stop 1.0 × ATR, no take profit, 3.0 × ATR trailing).
| Setup (H1) | Net profit | Profit factor | Trades | Win rate | Max equity DD |
|---|---|---|---|---|---|
| XAUUSD + JP225, Supertrend + EMA | +32,478 | 1.51 | 439 | 31.7% | 14.2% |
| XAUUSD only, Supertrend + EMA (defaults) | +11,624 | 1.49 | 215 | 30.7% | 15.5% |
| USDJPY + XAUUSD + USDCAD + JP225, all filters | +11,391 | 1.97 | 116 | 36.2% | 17.2% |
A low win rate is normal for a trend follower: many small stopped trades, fewer but much larger winners that are trailed.
Year 1 vs year 2
| XAUUSD + JP225 | Period | Net profit | Role |
|---|---|---|---|
| Year 1 | Oct 2024 – Oct 2025 | +7,094 | settings chosen here |
| Year 2 | Oct 2025 – Oct 2026 | +25,384 | out-of-sample check |
Real-tick run, balance carried over (compounding). 21 of 25 calendar months closed with a profit.
The study, step by step
- Markets × timeframes × modes. 18 symbols (gold, silver, majors, crosses, US/EU/UK/JP indices), M5 to H4, three signal modes – 270 combinations.
- Exit tuning on the nine best candidates: stop 1–3 ATR, take profit 0–4 ATR, trailing 1–3 ATR, breakeven on/off, Supertrend multiplier 2–4 (450 combinations each). One exit style won almost everywhere: tight stop, no fixed target, wide trailing stop.
- That exit on every market (540 combinations): H1 is the best timeframe; M5/M15 lose. The edge is market-specific – gold and the Nikkei 225 – not universal.
- Portfolios were built from year-1 results only, then checked on year 2 and with real ticks. A 6-symbol portfolio that looked best in year 1 almost broke even in year 2 (PF 1.03, 36% drawdown) and was rejected as fragile.
What did not work
So you know where not to use the defaults.
| Single symbol, H1, default exits | Year 2 net | Profit factor |
|---|---|---|
| USDJPY | −2,207 | 0.76 |
| US500 | −2,987 | 0.66 |
| DE40 | −957 | 0.88 |
| USTEC | −823 | 0.88 |
Limits of these results. One broker's data and spreads (IC Markets demo). Two years that include a strong gold uptrend and a strong Nikkei year. Profits compound, so compare profit factor and drawdown, not only net profit. These are backtests, not live trading, and they do not guarantee future results.